Normal Distribution Joyplots
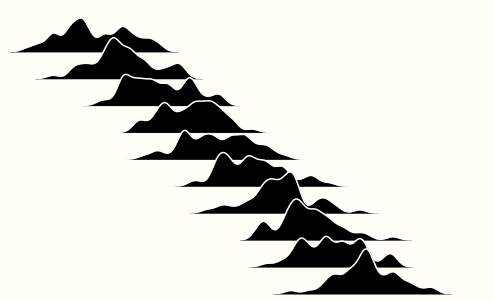
Joyplots are partially overlapping line plots that create the impression of a mountain range. The name
joyplot is in reference to the
iconic
cover art for Joy Division’s album
Unknown Pleasures. They are a thing of beauty, just look at this one I made:

We are going to use joyplots to visualize a fundamental fact about Normal Distribution:
The general Normal distribution has two parameters, denoted μ and σ2, which correspond to the mean and variance (so the standard Normal is the special case where μ=0 and σ2=1). Starting with a standard Normal r.v. Z ∼N(0,1), we can get a Normal r.v. with any mean and variance by a location-scale transformation(shifting and scaling).
Location Transformation (Shifting)
%matplotlib inline
import numpy as np
import pandas as pd
import seaborn as sns
import matplotlib.pyplot as plt

standard_normal_rv = np.random.normal(loc = 0, scale = 1, size = 2000)
nrv_1_1 = np.random.normal(loc = 1, scale = 1, size = 2000)
nrv_2_1 = np.random.normal(loc = 2, scale = 1, size = 2000)
nrv_3_1 = np.random.normal(loc = 3, scale = 1, size = 2000)
nrv_4_1 = np.random.normal(loc = 4, scale = 1, size = 2000)

dist_labels = np.tile(["N(0,1)", "N(1,1)", "N(2,1)", "N(3,1)", "N(4,1)"], 400)
dist_aggr = []

for dist_label, rv_0, rv_1, rv_2, rv_3, rv_4 in zip(dist_labels, standard_normal_rv, nrv_1_1, nrv_2_1, nrv_3_1, nrv_4_1):
    if dist_label == "N(0,1)":
        dist_aggr.append(rv_0)
    elif dist_label == "N(1,1)":
        dist_aggr.append(rv_1)
    elif dist_label == "N(2,1)":
        dist_aggr.append(rv_2)
    elif dist_label == "N(3,1)":
        dist_aggr.append(rv_3)
    else:
        dist_aggr.append(rv_4)

df = pd.DataFrame(dict(l = dist_labels, dist = dist_aggr))

def joyplot(df, font_size, xtick_labelsize, xlim_range, ylim_range, label_fontsize, xlabel_text):

    sns.set(style = "white", rc = {"axes.facecolor": (0, 0, 0, 0),
                                   "font.family": "mononoki",
                                   "font.size": font_size,
                                   "xtick.labelsize": xtick_labelsize,
                                   "figure.facecolor": "fffff8"})

    pal = ['#30a2da', '#DC143C', '#FFC400', '#6d904f', '#8A2BE2']
    g = sns.FacetGrid(df, row = "l", hue = "l", aspect = 15, size = .65, palette = pal)

    g.map(sns.kdeplot, "dist", clip_on = False, shade = True, alpha = 1, lw = .1)
    g.map(sns.kdeplot, "dist", clip_on = False, color = "w", lw = 2)

    def label(x, color, label):
        ax = plt.gca()
        ax.text(-.05, .2, label, color = color,
                ha = "left", va = "center", transform = ax.transAxes)

    g.map(label, "dist")
    g.fig.subplots_adjust(hspace = 2)

    g.set_titles("")
    g.set(yticks=[])
    g.set(xlim = xlim_range)
    g.set(ylim = ylim_range)
    g.despine(bottom=True, left=True)
    label_font = {'family': 'ETBembo', 'size' : label_fontsize, 'style' : 'italic'}
    plt.xlabel(xlabel_text, **label_font, labelpad = 15)

joyplot(df = df, font_size = 13, xtick_labelsize = 12, xlim_range = (-5,5),
        ylim_range = (0,.07), label_fontsize = 18, xlabel_text = "Location Transformation (Shifting)")
Scale Transformation (Scaling)
standard_normal_rv = np.random.normal(loc = 0, scale = 1, size = 2000)
nrv_0_2 = np.random.normal(loc = 0, scale = 2, size = 2000)
nrv_0_3 = np.random.normal(loc = 0, scale = 3, size = 2000)
nrv_0_4 = np.random.normal(loc = 0, scale = 4, size = 2000)
nrv_0_5 = np.random.normal(loc = 0, scale = 5, size = 2000)

dist_labels = np.tile(["N(0,1)", "N(0,2)", "N(0,3)", "N(0,4)", "N(0,5)"], 400)
dist_aggr = []

for dist_label, rv_1, rv_2, rv_3, rv_4, rv_5 in zip(dist_labels, standard_normal_rv, nrv_0_2, nrv_0_3, nrv_0_4, nrv_0_5):
    if dist_label == "N(0,1)":
        dist_aggr.append(rv_1)
    elif dist_label == "N(0,2)":
        dist_aggr.append(rv_2)
    elif dist_label == "N(0,3)":
        dist_aggr.append(rv_3)
    elif dist_label == "N(0,4)":
        dist_aggr.append(rv_4)
    else:
        dist_aggr.append(rv_5)

df = pd.DataFrame(dict(l = dist_labels, dist = dist_aggr))

joyplot(df = df, font_size = 13, xtick_labelsize = 12, xlim_range = (-19,19),
        ylim_range = (0,.02), label_fontsize = 18, xlabel_text = "Scale Transformation (Scaling)")
Location-Scale Transformation (Shifting and Scaling)
standard_normal_rv = np.random.normal(loc = 0, scale = 1, size = 2000)
nrv_2_2 = np.random.normal(loc = 2, scale = 2, size = 2000)
nrv_4_3 = np.random.normal(loc = 4, scale = 3, size = 2000)
nrv_6_4 = np.random.normal(loc = 6, scale = 4, size = 2000)
nrv_8_5 = np.random.normal(loc = 8, scale = 5, size = 2000)

dist_labels = np.tile(["N(0,1)", "N(2,2)", "N(4,3)", "N(6,4)", "N(8,5)"], 400)
dist_aggr = []

for dist_label, rv_0, rv_2, rv_4, rv_6, rv_8 in zip(dist_labels, standard_normal_rv, nrv_2_2, nrv_4_3, nrv_6_4, nrv_8_5):
    if dist_label == "N(0,1)":
        dist_aggr.append(rv_0)
    elif dist_label == "N(2,2)":
        dist_aggr.append(rv_2)
    elif dist_label == "N(4,3)":
        dist_aggr.append(rv_4)
    elif dist_label == "N(6,4)":
        dist_aggr.append(rv_6)
    else:
        dist_aggr.append(rv_8)

df = pd.DataFrame(dict(l = dist_labels, dist = dist_aggr))

joyplot(df = df, font_size = 13, xtick_labelsize = 12, xlim_range = (-19,19),
        ylim_range = (0,.02), label_fontsize = 18, xlabel_text = "Location-Scale Transformation (Shifting and Scaling)")